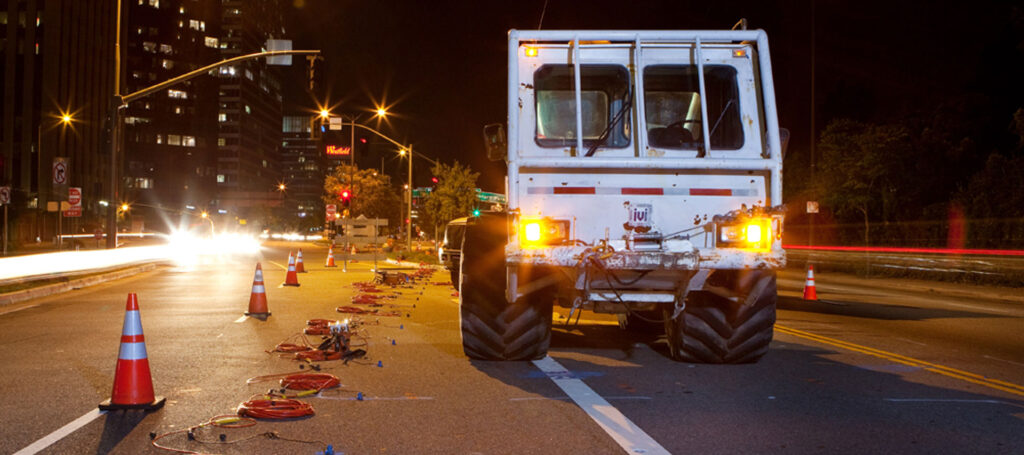
GEOVision applies geophysical techniques to get answers to a variety of environmental and engineering problems. Over our 29 year history, we have worked in a wide variety of locations around the world. Here are just a few of our most interesting projects.
Oroville Dam Spillway Failure Investigation
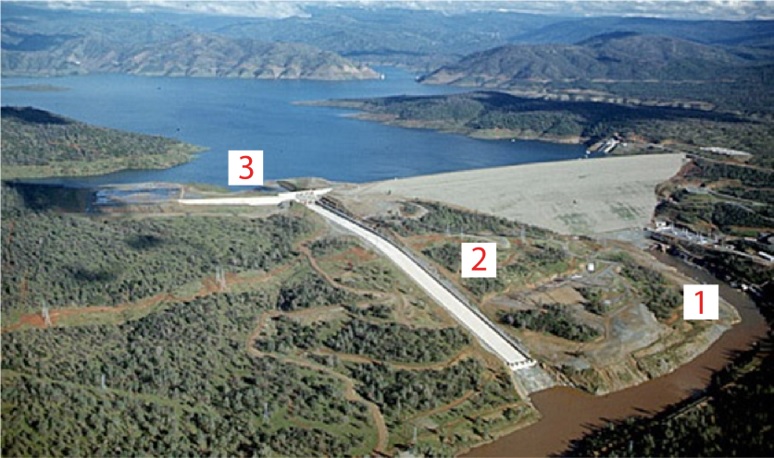
Figure 1. Lake Oroville Dam and Reservoir, circa 2015 (before spillway failure). Outflows from the reservoir are controlled from three locations: the power plant (1), the Main Spillway (2), and the Emergency Spillway (3).
“With a height of 770 feet, Oroville Dam is the tallest dam in the United States. Completed in 1968 and located north of Sacramento in the foothills of the Sierra Nevada mountains, this large earthfill embankment dam is owned by the California Department of Water Resources (DWR) and is one of the key features of the California State Water Project, which supplies water to more than 23 million people throughout California and is the largest state-owned water storage and delivery system in the United States.”1
“2017 was the second wettest winter on record in California. Heavy January rains in the Oroville drainage basin were causing the reservoir to quickly rise. Under normal operations, this was a manageable situation, and spillway releases at that time were well within design limits. That changed on the morning of February 7, when shortly after 10:00 AM, employees reported a substantial disturbance in water flow at the lower half of the spillway (Figure 2). The trunnion gates were closed by 12:25 pm, and inspection revealed that a significant portion of the spillway
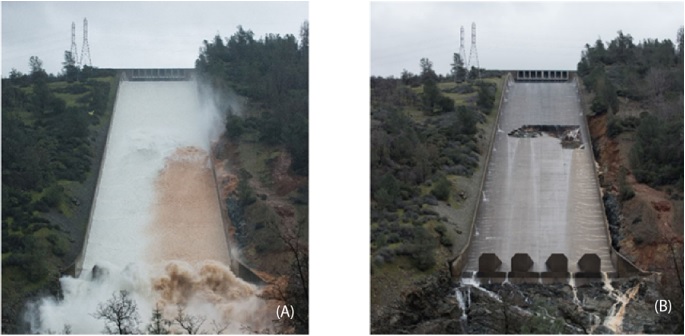
Figure 2. The Main Spillway (A) at time of first damage, February 7, and (B) shortly after shutdown showing initial damage.
slab had washed away, forming a large erosion hole where the slab sections were now missing. As inspections continued, lake waters continued to rise. The damaged Main Spillway had to be reopened, but outflows were reduced to minimize further damage. Operators knew further damage was certain, but the extent could not be predicted, and further erosion of the foundation rock and loss of additional slab sections occurred during this period. By that time, the majority of discharge flow was no longer confined to the spillway and was now channelized to the southeast, causing rapid and severe erosion of soil and rock south of the spillway (Figure 3).“2

Figure 3. Views of the Main Spillway (A) during post-failure managed emergency discharge in February 2017, and (B) shortly after shutdown for emergency repairs in March 2017. Note the extreme erosional damage from flow channelization at the right (southeast) side of the image.
Geophysics
Main Spillway
To determine the health of the main spillway, and to determine if there were any voids or washouts beneath the concreate, a GPR survey was proposed and conducted by the Geophysics and Geology Branch from the California Department of Transportation (Caltrans).
A Caltrans crew arrived on site the same day to perform ground penetrating radar (GPR) investigations on the remaining portion of the undamaged Main Spillway. Over the course of eight days, Caltrans personnel acquired a linear equivalent of 27.2 miles of GPR data in support of the repair efforts.
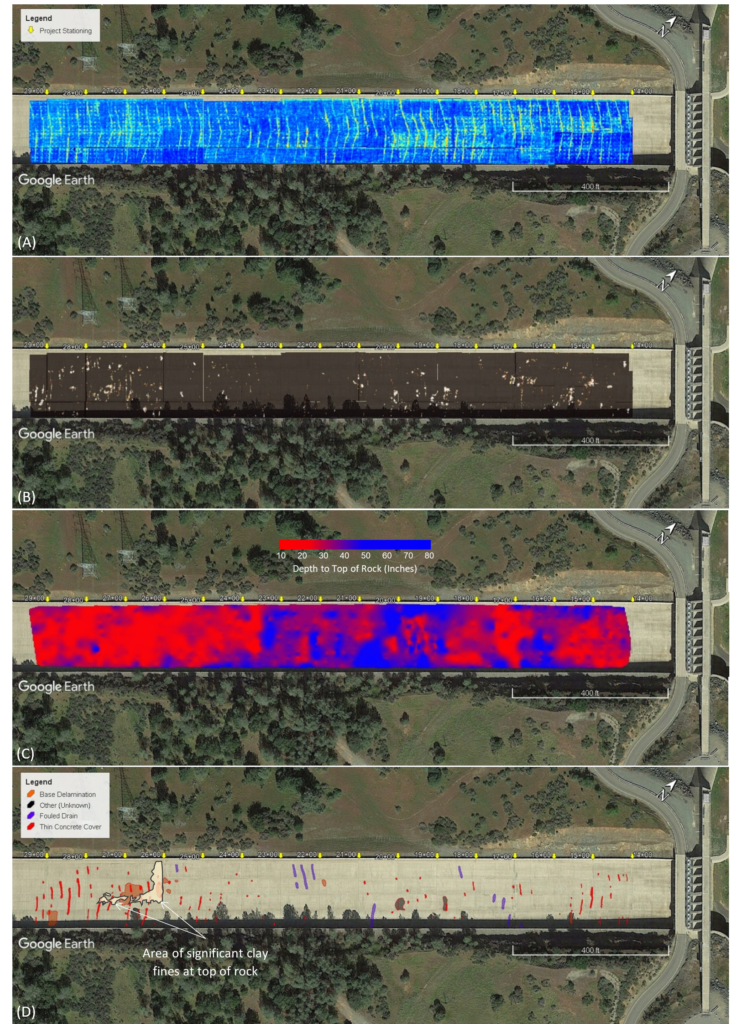
Figure 7. Plan view GPR maps produced for the Main Spillway. (A) Distribution of VCP drains and anchor mesh mats. (B) Discontinuities in bedrock below concrete. (C) Concrete thickness estimates. (D) Interpreted defects. Yellow arrows indicate project stationing. From Owen and Mallah (2017).
For a more detailed account of the GPR survey, see reference #2 below.
Emergency Spillway
To understand the conditions of the subsurface around the emergency spillway, seismic refraction, and borehole geophysics were proposed.
At the Emergency Spillway, a secant (cutoff) wall and concrete splashpad were to be constructed at the spillway base to attenuate flow energy and mitigate future headcutting in the event of activation. GEOVision Geophysical Services was contracted to provide geophysical support for the design of that repair.
P-wave seismic refraction was chosen to delineate depth to competent bedrock and provide seismic velocities for qualitative evaluation of rock hardness. Line placement was completed “on-the-fly”, and final locations were dictated by on-site conditions at the time of data collection. P-wave seismic refraction was acquired along 20 profiles, each with 1 to 4 overlapping spreads of 48 geophones. Geophone spacing ranged from 4.5 to 10 ft and total line lengths were 211.5 to 1,125 ft. A 20-lb. sledgehammer or a truck-mounted 240-lb. accelerated weight drop (AWD) were used as the seismic sources. All lines were collected outside of the damaged spillway (Figure 9).
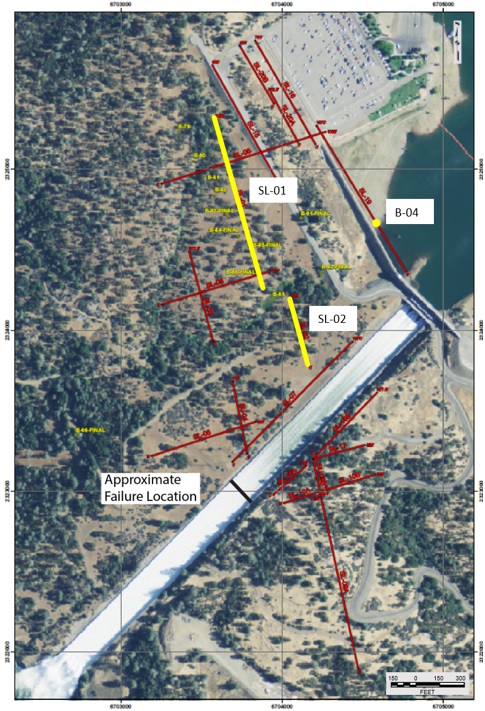
Figure 9. Locations of P-wave Seismic Refraction profiles and Borehole Geophysical logs. Highlighted locations (in yellow) shown in Figures 10-12. From Dalrymple (2017).
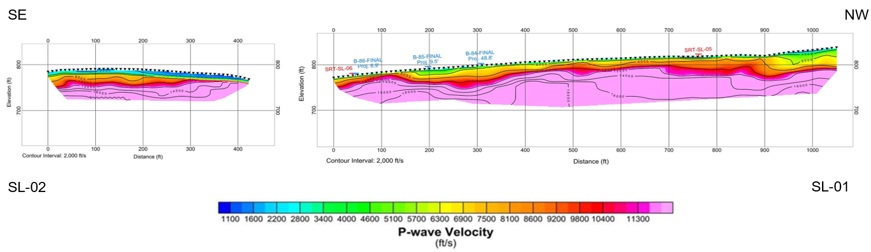
Figure 10. SRT-SL-01 and -02: Time-Term P-wave Seismic Tomography model, near the secant wall. Locations shown in Figure 9. View oriented looking downslope. Note that the weathered rock is thicker toward the northwest, with competent rock approaching the surface near the center and southeast of SL-01 and the northwest end of SL-02. From Dalrymple (2017).
Borehole geophysical logs were acquired at 95 locations across the project site. Boreholes were logged using a combination of Acoustic and Optical Televiewer and 3-Arm Mechanical Caliper logs. In situ velocity data were acquired at seven of the locations using a PS Suspension probe. Borehole logs were acquired as the drilling completed at each hole, and up to 10 drill rigs were simultaneously operated on site. That created a fast-paced, and dynamic geophysical logging schedule. To meet the demanding schedule, a logging crew remained on 24-hour standby at the site for approximately two months.
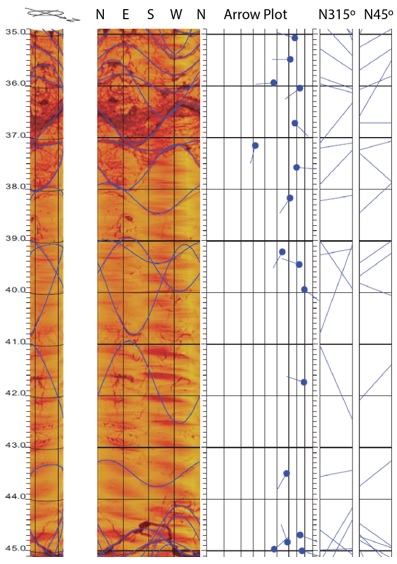
Figure 11. Borehole B-04, Acoustic Televiewer, 35 to 45 ft depth range. From Diehl (2018).
The borehole geophysical logging, along with the seismic refraction surveys, provided rock depth, correlated rock types, and general conditions surrounding the spillway. Borehole logs that were in close proximity to the seismic refraction data showed good agreement, revealing a highly variable, weathered, and fractured rock profile throughout the site.
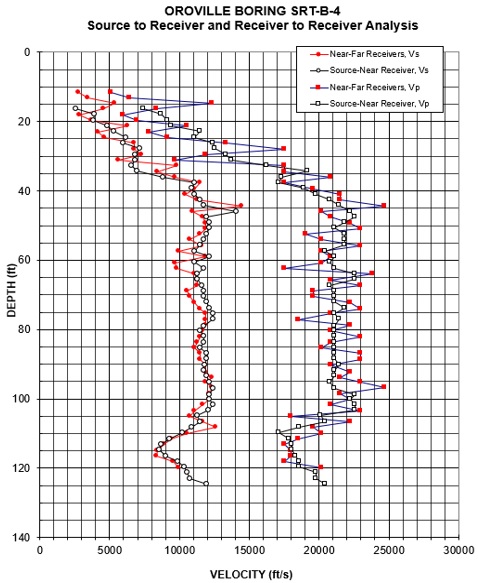
Figure 12. Borehole B-04, PS Suspension Log. Location shown in Figure 9. From Diehl (2018).
References:
- ASDSO Case Study: Oroville Dam (California, 2017) Lessons Learned: https://damfailures.org/case-study/oroville-dam-california-2017/
- Geophysical Investigations for the Emergency Response to the February 2017 Spillway Failure at Oroville Dam, California: https://fasttimesonline.co/geophysical-investigations-for-the-emergency-response-to-the-february-2017-spillway-failure-at-oroville-dam-california/
- Dalrymple WM, 2017, GEOVision report, Oroville Dam seismic refraction survey 17125-01: Report prepared for the California Department of Water Resources, DOE – Project Geology, Oroville Spillway Restoration Team, GEOVision Geophysical Services, Inc., 06/16/2017, 61 pages.
- Diehl JG, 2018, GEOVision Report, Oroville Dam borehole geophysics 17101-01 rev 3: Report prepared for the California Department of Water Resources, DOE – Project Geology, Oroville Spillway Restoration Team, GEOVision Geophysical Services, Inc., 03/13/2018, 1568 pages.
- Owen W, and Mallah M, 2017, Mutual aid report, Oroville Dam spillway GPR investigation: Report prepared for the California Department of Water Resources Division of Operations and Maintenance, California Department of Transportation, Sacramento.
Additional Links:
CA DWR Independent Forensic Team: https://water.ca.gov/Programs/State-Water-Project/SWP-Facilities/Oroville/Oroville-Spillways/Forensic-Team
Hills Creek Dam Investigation
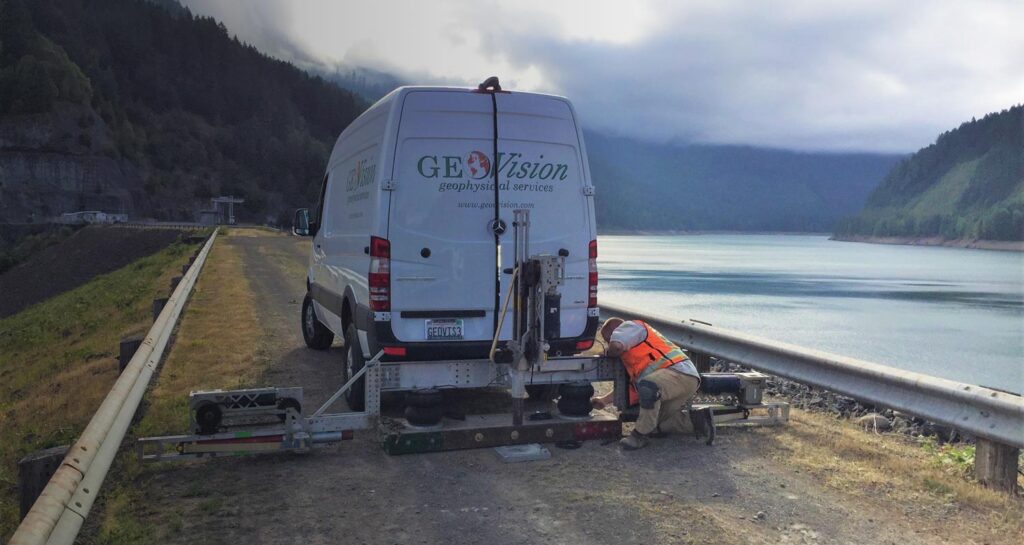
GEOVision acquired borehole geophysical data in ten borings, including one cross-hole triplet at Hills Creek Dam near Oak Ridge Oregon. The work was performed for the US Army Corps of Engineers under subcontract.
The purpose of this project was to supplement stratigraphic information obtained during the drilling investigation, and to compare the efficacy of different methods of measuring seismic velocities in this embankment dam environment.
The borings were 8″ sonic drilled, grouted and cased with PVC.
Results
Gamma and Conductivity Logging
A Robertson GEO, Inc. (RG) High Resolution Acoustic Televiewer (HiRAT) was used to collect borehole deviation data and acoustic televiewer images of the casing/grout contact at 0.004 foot intervals. Acquired data were analyzed and a profile of borehole deviation versus depth was produced for each boring. An image of the PVC casing/grout contact was produced and annotated with identifiable features based upon the televiewer image and the driller’s grout logs.
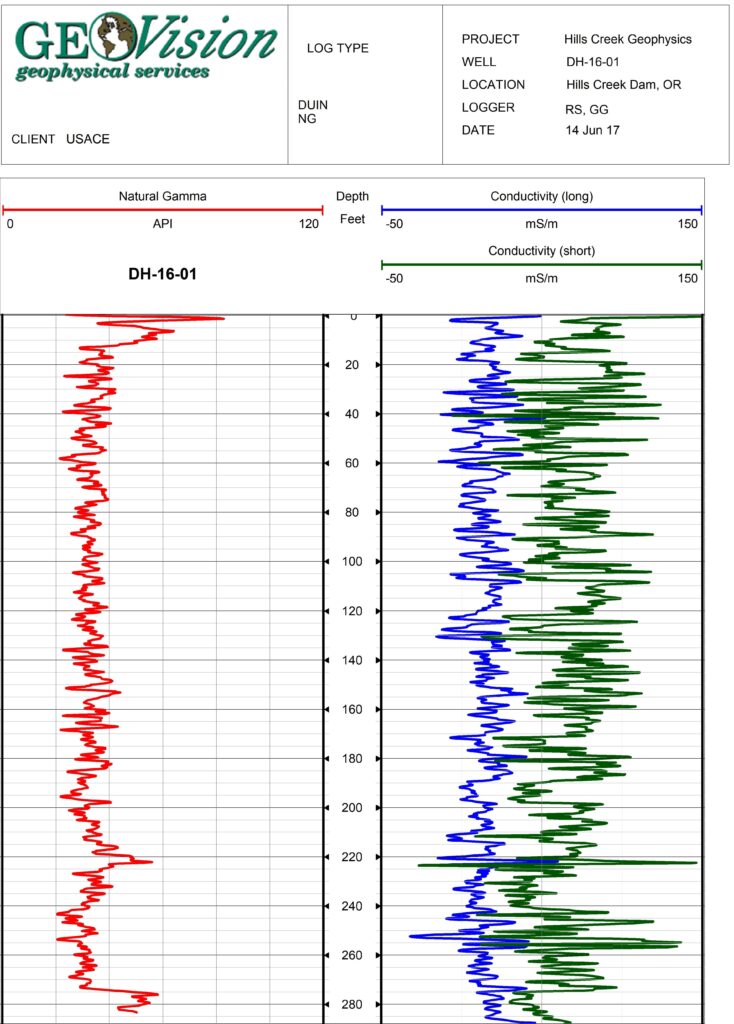
A Robertson GEO (RG) Dual Induction (DUIN) probe was used to collect long and short electrical conductivity and natural gamma data in each boring at 0.050 foot intervals.
Measurement procedures followed these ASTM standards:
- ASTM D5753-05 (Re-approved 2010), “Planning and Conducting Boring Geophysical Logging”
- ASTM D6274-10, “Standard Guide for Conducting Borehole Geophysical Logging – Gamma”
- ASTM D6726-15, “Standard Guide for Conducting Borehole Geophysical Logging – Induction”
A representative log from borehole DH-16-01 is shown below.
Suspension Logging
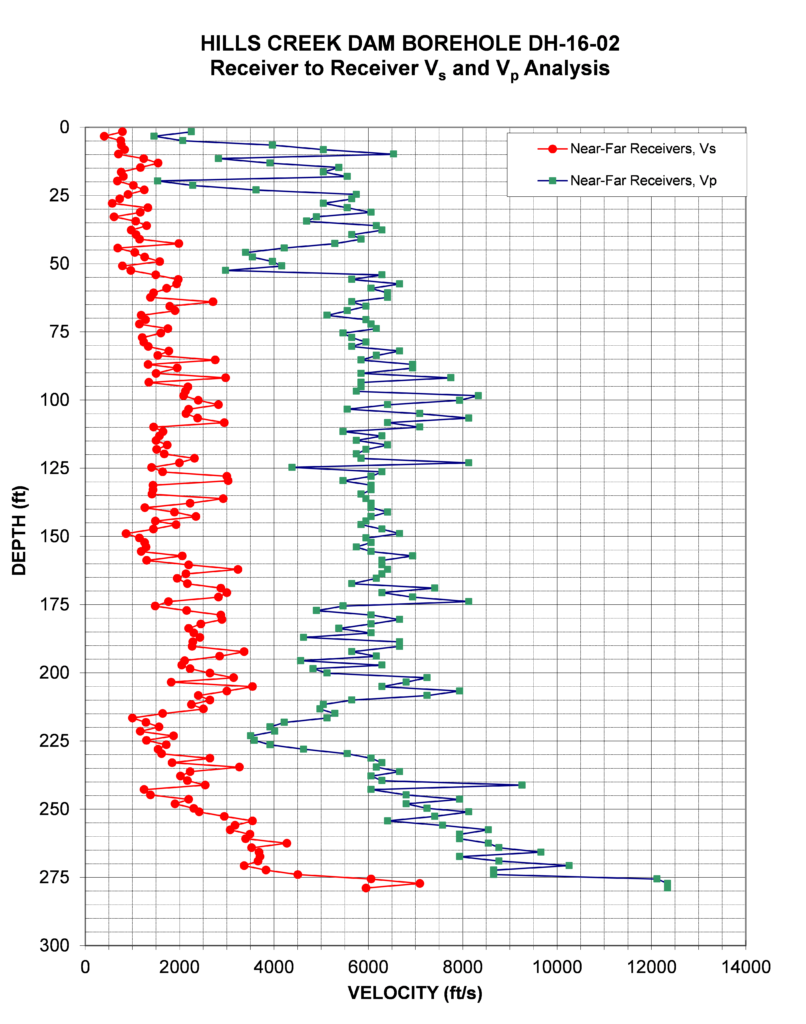
Equipment used consisted of the OYO (Robertson) P-S suspension tool, which was used to collect in-situ horizontal shear (SH) and compressional (P) wave velocity measurements at 0.5m intervals in all boreholes.
Results from borehole DH-16-02 are shown below. Shear wave velocity (VS) is shown in red and plots to the left of the graph, with compressional wave (VP) velocity, which is higher speed plotting to the right in green & blue.
Downhole Logging
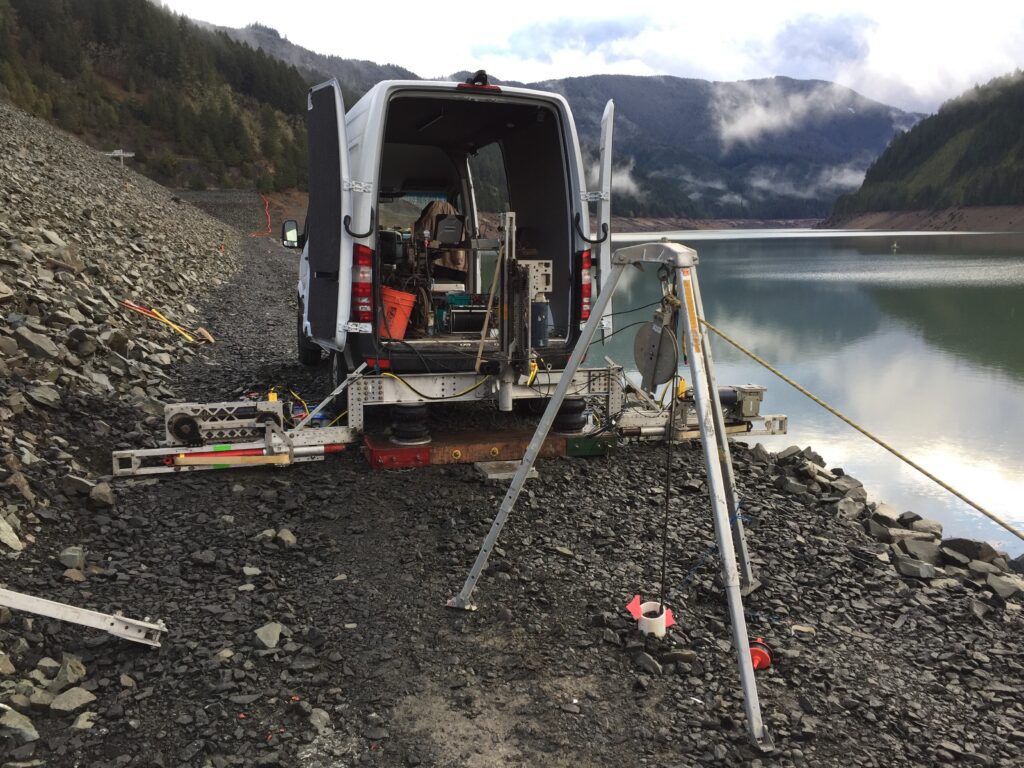
Downhole seismic velocity was collected in all borings except 2 at 1.5m intervals, using a downhole triaxial geophone and the GEOVision proprietary “Triple Whammy” triple elastic accelerated weight drop source (shown in the photo above).
All downhole procedures followed the ASTM D7400-14, “Standard Test Methods for Downhole Seismic Testing” in order to create a profile of velocity versus depth both SH and P waves.
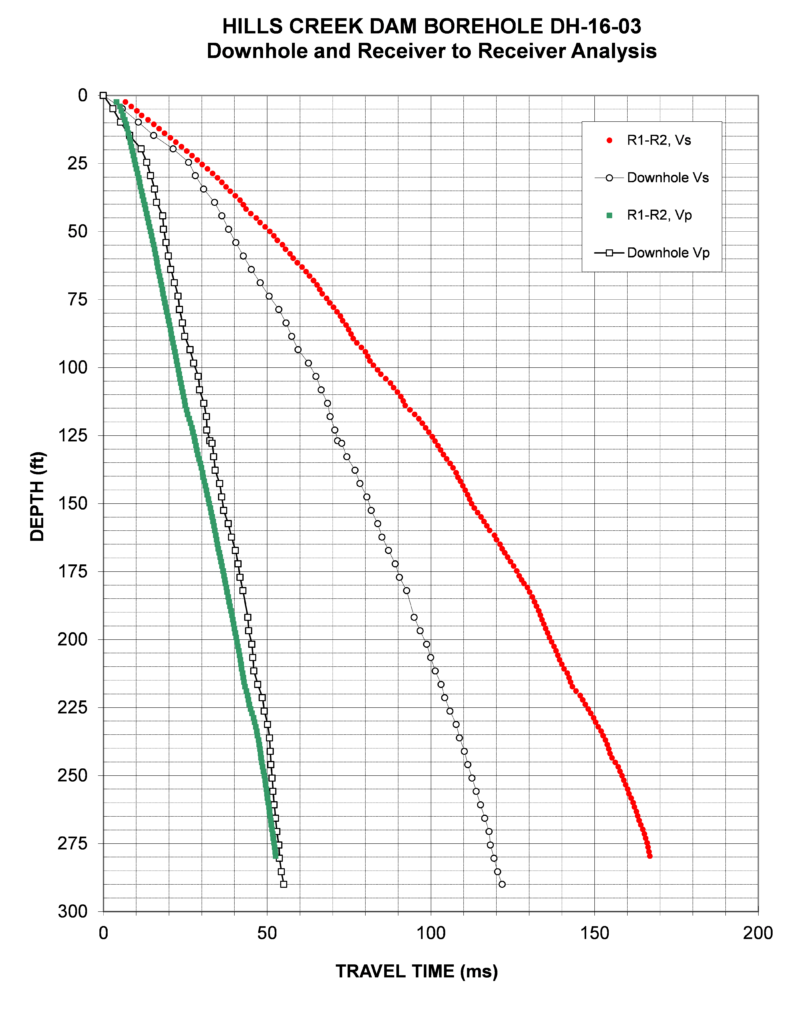
In the graph below, two logs from different techniques are plotted together to show how well they agree – or don’t!
The red dots and green squares are P-S suspension logging data for borehole DH-16-03. Green squares represent P wave data points which are faster than the red dot shear waves which plot to the right, representing slower velocities. Empty squares indicate downhole P wave data, and the empty circles show downhole shear wave data. The P wave data is fairly consistent with depth, however the shear wave data shows significant deviation.
Crosshole Logging
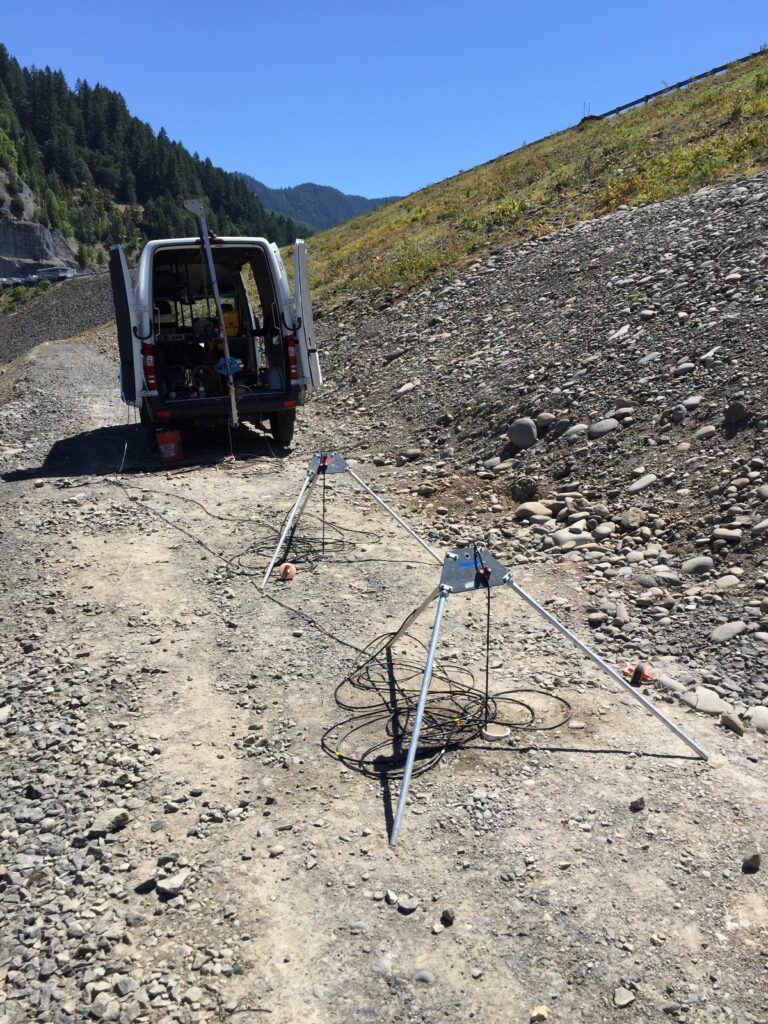
Crosshole seismic velocity data were collected at 1m intervals in the boring triplet, with the source being located in each end boring, giving two crosshole data sets for both shear and P waves. A bidirectional solenoid source was used to produce vertically polarized shear waves (SV). A Trident Systems Sparker was used during separate runs to produce P-wave signals. Both SV and P waves were recorded using a pair of Geostuff BHG-3 orientable triaxial borehole geophones. Acquired data were analyzed and a profile of velocity versus depth was produced for both SV and P waves.
Crosshole procedures followed ASTM D4428/D 4428M -14, “Standard Test Methods for Crosshole Seismic Testing.”
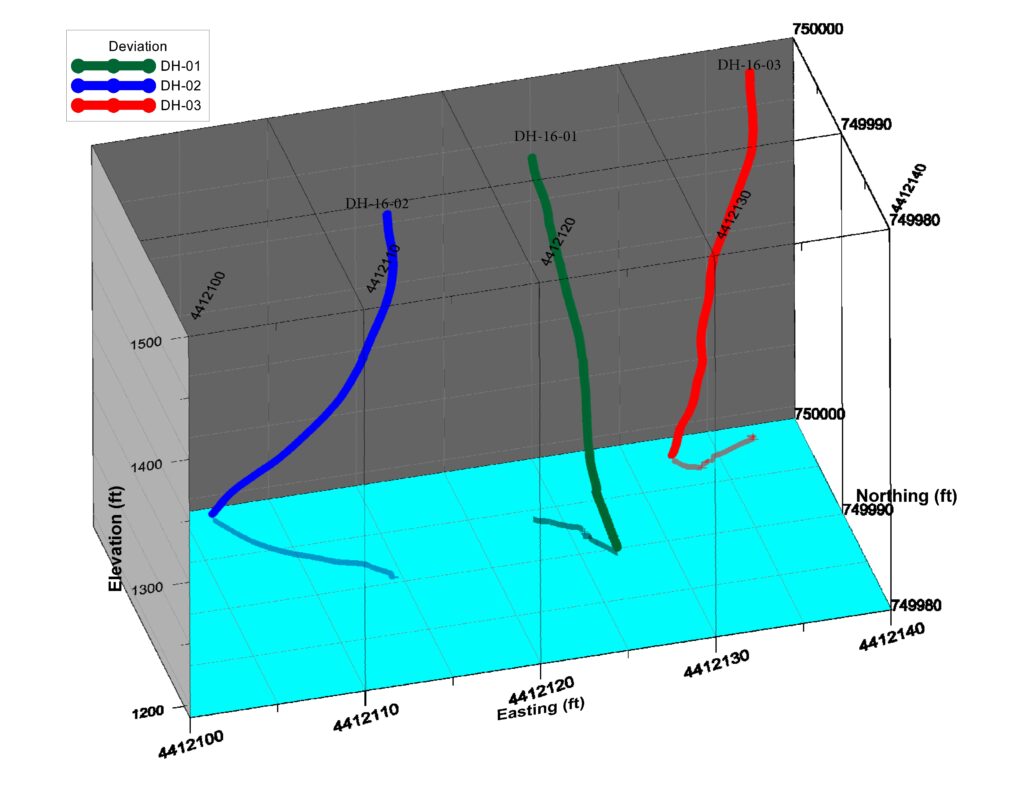
When doing crosshole seismic, the exact deviation of all boreholes must be accurately measured, as deviation from vertical will introduce errors in the travel time calculations. A deviation survey was conducted in each of the triple boreholes (shown in the figure above), and corrections were made for the observed variations.
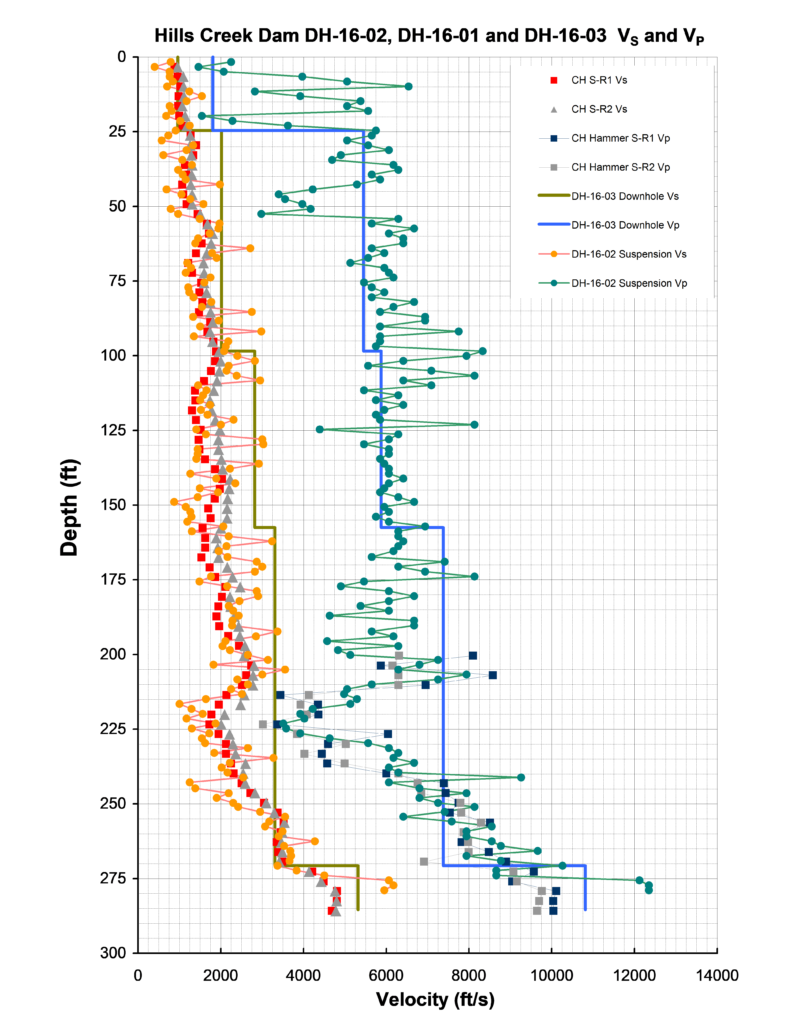
The results shown below are from the triplet boreholes. The graph shows all the three methods collected (crosshole, downhole and P-S suspension logging) to show a comparison of the results from each technque.
- CH S: Crosshole shear wave data using a solenoid source
- CH Hammer: Crosshole P wave velocity collected using the Sparker
- DH: downhole using the Triple Whammy
- Suspension: P-S suspension logger.
LA Metro Fault Investigation